Relevant to: Sponsored Products, Sponsored Brands
This article provides an overview of Custom Reports, including how to navigate the dashboard, and build, save and export your own custom reports.
About Custom Reports
Showcase your product to millions of shoppers directly in their search results. This guide covers key topics for using our self-serve platform.
Relevant to: Sponsored Products, Sponsored Brands
This article provides an overview of Custom Reports, including how to navigate the dashboard, and build, save and export your own custom reports.
About Custom Reports
Custom Reports can help you gain more insight into the performance of your Walmart Connect Sponsored Search campaigns. Advertiser reports are segmented at a daily level, campaign level, page-type level, or platform level. With Custom Reports, you can further analyze your campaigns by building customized reports across different or multiple time ranges, campaigns and more.
Benefits of Custom Reports
Custom Reports dashboard
The Custom Reports dashboard is customizable using dimensions and measures along the left-hand side. Dimensions determine the level at which you want to view performance data. You can drag and drop dimensions to either the Filter By or Split fields. These become the rows of your table.
You can nestle multiple dimensions with each other by dragging them over to the Split field. For example, if you wanted to compare brand level performance by day, you would drag Brand next to Date in the Split field. Dragging Dimensions into Filter By allows you to select specific aspects of the dimension, such as certain brands under your advertiser and specify a date range. In Split, dimensions become the rows of the table.
Measures are your performance metrics. These can be dragged and dropped into the Measure field to become the columns of the table.
Note: The order that they appear in the Measure field will be the same order they appear in your table.
Units Sold and Sales Revenue have the option of being viewed at a 3-, 14-, or 30-day attribution, and they can be viewed by direct click or other click.
Both Dimensions and Measures can easily be removed from any field by clicking the X in the corner of the metric box.
The cells you see in the dashboard provide a numerical and visual representation of the performance data. They emulate a vertical bar graph to help pinpoint high- and low-performing areas.
To get a more visual representation of your data, there is the option to view a line chart. You can easily switch between the two views by clicking on the default Table Report and selecting Line Chart Report from the dropdown.
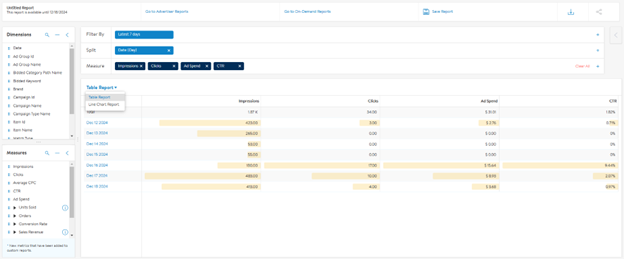
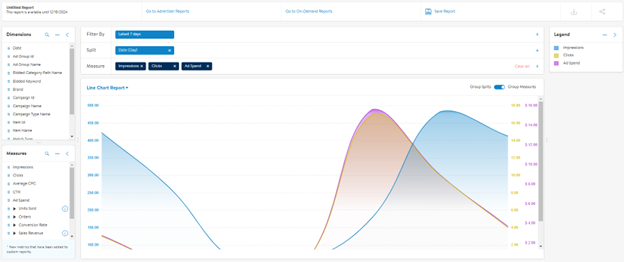
Note: The Line Chart Report is limited to showing 3 measures.
Available dimensions and metrics:
Dimensions:
Date: Day, Week, Month*
Ad Group Id
Ad Group Name
Bidded Category Path Name
Bidded Keyword
Brand
Campaign ID
Campaign Name
Campaign Type Name
Item Id
Item Name
Match Type
Page Type
Placement
Platform
Measures:
Impressions
Clicks
Average CPC
CTR
Ad Spend
Units Sold
Conversion Rate
Sales Revenue
New-to-Brand metrics: New-to-Brand Orders, % of New-to-Brand Orders, New-to-Brand Sales, % of New-to-Brand Sales, New-to-Brand Units, and % of New-to-Brand Units
ROAS
Note: In the Brand dimension, you may see Unknown for certain rows when your report is filtered by Item Id. This is expected for logo-related activity in Sponsored Brands and is explained below.
Using time shift
Time shift enables you to compare the performance between sets of metrics over different time ranges in one side-by-side view, adding an extra column to show the difference over time. Red values show a decrease while green shows an increase.
Reporting limits
There are row limits that may impact how much data you can see and download at a time.
You are allowed up to three fields in Split. For the first split added, there is a default limit of 5 rows, except for the date field.
For the date field, the maximum limit is 100 rows. Please note that there is only one date field. For the second split added, there is a default limit of 5 rows with the possibility to increase it up to 100 rows. For the third split added, there is also a default limit of 5 rows with the possibility to increase it up to 100 rows. If a maximum of three splits is added, then the total of one million rows is available for download (100 x 100 x 100).
The Line Chart Report can only show three Measures and two Split fields at a time.
In some Custom Reports, you may notice rows where the Brand value appears as Unknown in the brand breakdown. This can occur when the report is filtered by Item Id and includes logo-related activity from Sponsored Brands Ads (SBA) campaigns.
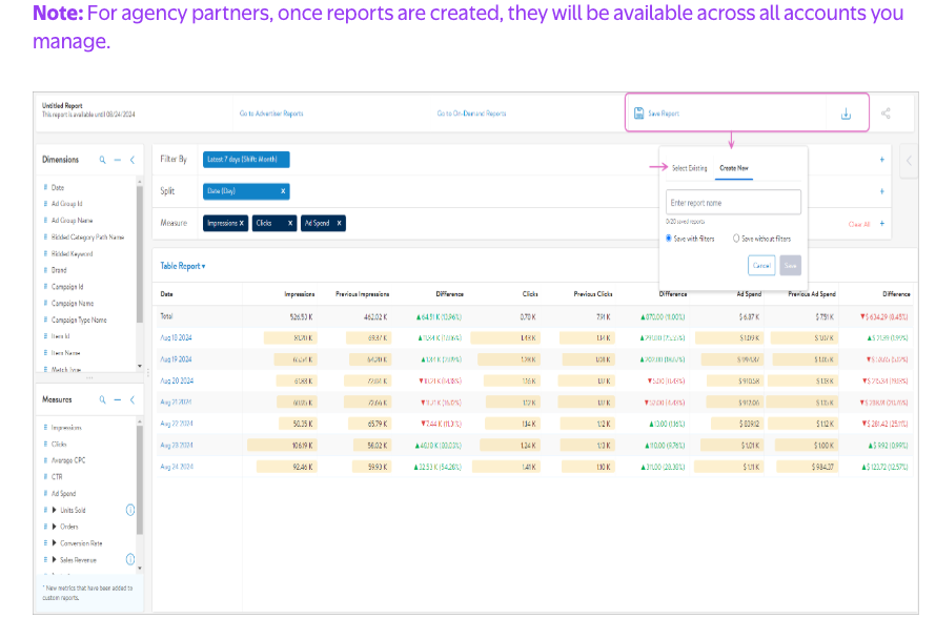
Saving and exporting custom reports
You can save and export your custom reports in the Custom Reports dashboard.
To save a custom report, click the Save Report button at the top of the dashboard. You can either select and save over an existing report or create a new one. All saved reports will appear under the Saved Reports section. Once saved, you can edit the report, export it as a .CSV file, or delete it using the trashcan icon.
To export a custom report, click the download symbol next to the Save Report button. This will instantly download a report as a .CSV file enabling you to work with the data directly.