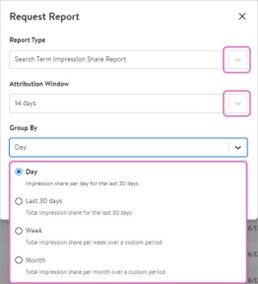
This article provides an overview of On-demand reports which provide campaign and ad group level metrics and data. Multiple reports are available for download, and this guide provides details on each of them.
Showcase your product to millions of shoppers directly in their search results. This guide covers key topics for using our self-serve platform.
This article provides an overview of On-demand reports which provide campaign and ad group level metrics and data. Multiple reports are available for download, and this guide provides details on each of them.
Request an On-demand report
To request an on-demand report, navigate to the Reports heading and select On-demand.
Note: For the Campaign Snapshot report, there are no additional options required.
Your report has now been requested. It may take up to 30 minutes for your report to be generated. You can refresh the On Demand reports screen to view the current status.
Once the report status has changed from Pending to Generated, you will be able to download the report by clicking the icon.
Note: Reports will expire after 3 days and won't be available for download. If you still need the report, please submit a new report request.
Available report types
This section provides information on the available report types. Click the links to jump to a specific report type.
This report indicates which keywords your advertised items are being served against. This information can help you optimize keyword bids.
Inside this report there are two new columns for Bid and Average CPC.
Important: Keyword and Item Keyword Performance reports only show impression data for keywords with clicks, attribution, or ad spend greater than 0. The new reporting condition speeds up report generation and reduces the size of reports by over half.
This report provides key performance metrics for your campaigns by the placement the ads are served in. This information can help you to improve current and future Sponsored Products campaigns. Use bid multipliers to optimize placements based on their performance.
Below is a breakdown of the ad placements each type of campaign has the opportunity to serve on:
Placement | Automatic | Manual |
Search In-grid | X | X |
Browse In-grid | X |
|
Search Carousel | X | X* |
Browse Carousel | X |
|
Item Carousel | X | X* |
Buy Box | X | X* |
Home Page | X |
|
* If enabled
This report indicates which keywords your advertised items are being served against, and how well the advertised items are performing for those keywords. The Item Keyword performance report identifies keywords and provides performance data for ads served in Search In-grid placements. This information can help you improve current and future campaigns.
The Item Keyword performance report data does not match the data that appears in the Sponsored Search dashboard under Performance summary. The goal of the item keyword performance report is to provide specific data that provides insight into specific item keyword performance that you won’t find in the combined metrics in the Performance summary.
If this report provides different data than shown in the Performance summary, it means that ads were served to customers in other ad slots (such as Carousel and Buy Box), but the report cannot show the keywords searched in those placements.
Important: Keyword and Item Keyword Performance reports only show impression data for keywords with clicks, attribution, or ad spend greater than 0. The new reporting condition speeds up report generation and reduces the size of reports by over half.
This report provides key performance metrics for the items in all of your campaigns, in addition to their attribution by fulfillment type, Shipping and Curbside pickup and delivery. This information can help you improve current and future Sponsored Products campaigns.
Inside this report there are two new columns for Bid and Average CPC.
This report offers granular insights into purchased products attributed to your Sponsored Search campaigns, with data grouped by cumulative vs daily. It can be downloaded in CSV format. This tool allows advertisers to identify new ad opportunities and understand which products are engaging new-to-brand customers. The reported items are always within your own account portfolio.
Key features
The report includes click-based attributed metrics for 3, 14 and 30-day attribution windows.
The data is segmented by campaign and ad group names and IDs, attribution types, advertid item IDs and names, sales figures, orders, units sold and new-to-brand metrics like sales revenue and percentages.
Note: The report includes all attributed direct and other items (halo). It is available only for eligible campaigns with Total Orders greater than 0 for the requested period.
The Search Term Impression Share Report provides you with impression share insights at the search term level, you can use these insights to optimize your ad performance. You can see your ad impression share and rank for your Sponsored Products In-grid placement as well as for the top four ad positions.
Note: The data in this report focuses on search terms with at least one impression, prioritizing the most relevant and high-impact terms.
Search term impression share and top-of-search impression share includes opportunities for when the advertiser is currently out of budget. It represents the percentage of customer search queries that could have received an ad impression, assuming budget is not a constraint. This calculation is a more comprehensive view of the advertiser's potential reach and reflects all potential instances when an ad may have served, regardless of the advertiser's budget.
Note: This report only includes Search In-grid ads for manual and automatic Sponsored Products campaigns.
Report breakdowns available:
All breakdowns have a maximum limit of 330,000 rows, so for weekly and monthly breakdowns, those rows are divided by the number of weeks or months you select using the date selector. For example, if you are looking back three months, each month can have up to 110,000 rows. The same applies for weekly.
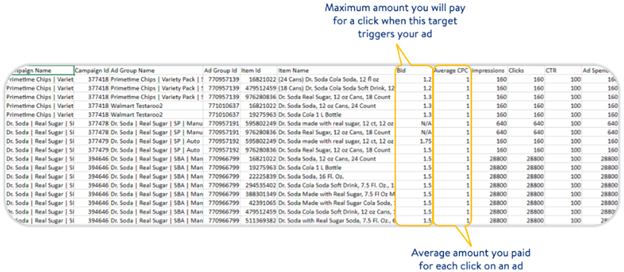
All report breakdowns also include standard performance and conversion metrics available on other reports, such as average cost-per-click and ROAS.
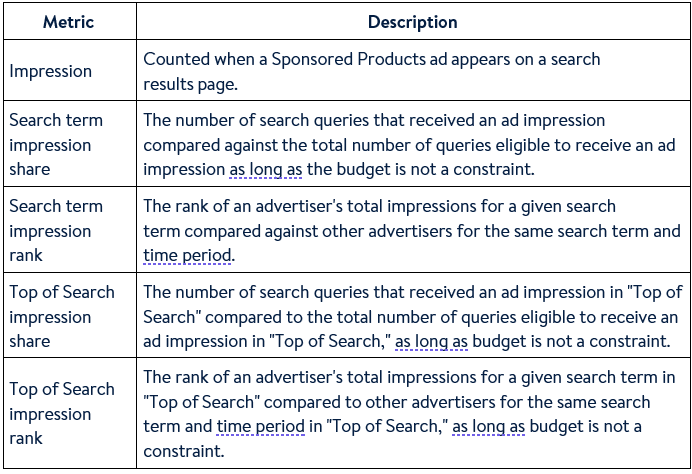
Use Search Term Impression Share Report to identify opportunities to improve your campaign performance. Low impression share and rank, but high click-through rate could indicate an increase in ad spend to yield more conversions. High impression share but low Top of Search impression share and click-through rate could indicate that ads are not showing up in the premium placements on Search In-grid.
Use this information to reallocate budget to competitive keywords or increase spend limits to help maximize exposure and conversions. Remember to request and download the report regularly to monitor for fluctuations in share and ranking. Changes can help identify possible trends and new opportunities.